 |
 |
|
||||
|
|
||||
|
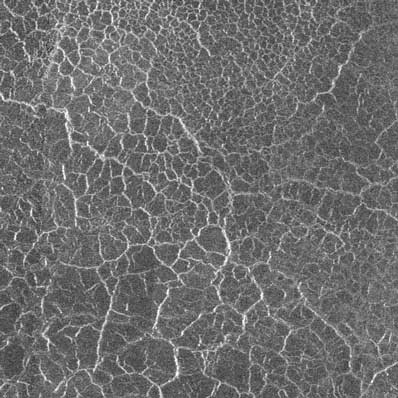
Cracking the mystery to Venus' climate change NASA/JPL NEWS RELEASE Posted: March 13, 2001 A mathematical model of the surface of Venus could show how the hot, dry surface has reacted to changes in temperature throughout the planet's history. Patterns of cracks were found on Venus' 500-degree surface by NASA's Magellan spacecraft in the early 1990s. Using an analysis technique by Pierre Moreels, a French intern at NASA's Jet Propulsion Laboratory, Pasadena, Calif., the patterns proved to be roughly hexagonal. This kind of cracking pattern shows that the surface has heated and cooled by almost 200 degrees Celsius (392 degrees Fahrenheit) over long periods of time.
"The program uses an analogy to the Earth's watershed process to filter out the noise from the radar imaging system on Magellan," Moreels said. "It finds the regions in the surface covered with patterns of multi-sided shapes. The more of these areas of multi-sided shapes we find, the better we can understand the history of climactic change on Venus." Moreels and his mentor, Dr. Sue Smrekar, a research scientist in JPL's Geophysics and Planetary Geology section, report their results today at the Lunar and Planetary Science Conference in Houston, Texas. The Magellan spacecraft took pictures of large areas of fissures, analogous to cooling basalt fractures on Earth, but on a much larger scale. The mathematical program filters out recurring radar noise by mapping the cracks into a graph simulating a field of mountains Ł the rougher the surface, the higher the peak. The program fills in the valleys of the simulated landscape, much as rain fills in a lake. This way, small peaks of radar noise are covered over, and only the dramatic changes in the surface's roughness remain.
Slow heating and cooling globally could have formed large areas of cracks on Venus' surface. A major episode of resurfacing occurred on Venus roughly 700 million years ago, in which water and sulfur levels in the atmosphere rose. Mapping the size and distribution of the cracks will help determine whether they are the result of local or global heating. Other models, in which volcanoes heat the surface or flows erupt on the surface and cool, have difficulties in explaining the size of these polygons. The California Institute of Technology in Pasadena manages JPL for NASA.
|
|
|||||